Debugging JavaScript
- Debugging with RhoSimulator
- Requirements
- 1- Launch Your App in RhoSimulator
- 2- Examine Code With Web Inspector
- 3- Live-Editing HTML and CSS
- 4- Debugging JavaScript Code
- On-Device Debugging With Weinre
- On-Device Debugging With Chrome
- Running RhoSimulator From the Command Line
Debugging with RhoSimulator
What is RhoSimulator?
RhoSimulator is a device simulation environment for RhoMobile apps that’s part of the standard RhoMobile Suite installation and is fully untegrated within the IDE. It also can run from a command line and integrate with other IDEs, if desired. RhoSimulator provides an easy way to run, view, test and debug the visible portions of your RhoMobile applications before further testing on hardware or hardware emulation.
RhoSimulator builds and runs your apps more quickly than do other environments, and is therefore useful for rapid test-and-debug cycles. Under RhoSimulator, most app changes can be seen live or by after the ‘Refresh’ button. In most cases, there’s no need to rebuild the app or restart RhoSimulator after making changes to an app. The only exceptions are for modifications to the AppApplication class or after adding or editing a model.
RhoSimulator uses the QT Webkit to render the UI portion of your app and approximate its appearance on Android, iOS and Windows Mobile platforms. App UI views might appear differently on the actual hardware* due to variations in platform rendering engines. Also, RhoSimulator is NOT an emulator, and therefore excludes camera, barcode scanner and other hardware features that might be present in an emulator for your specific hardware platform. After initial debugging with RhoSimulator, we recommend further testing on your platform’s hardware or emulator to ensure that your app behaves as desired.
| * RhoMobile apps for Android use the stock Webview control (Webkit or Blink, depending on Android version). Apps for iOS use the stock Safari Webkit, and for Windows Mobile and CE use Zebra's custom-developed Webkit. |
RhoSimulator can:
- Simulate Android, iOS and Windows Mobile
- Debug Ruby and JavaScript code
- Live-edit HTML and CSS
- Diagnose network activity and AJAX calls
- Run on Mac OS X and Windows development hosts
- Simulate iOS on a Windows host
- Simulate Windows Mobile on a Mac
RhoSimulator cannot:
- Simulate camera, barcode reader or certain other hardware
- Run on a Linux development host
- Perfectly emulate the target hardware platform
- Render accurately for all Webkits and target platforms
Requirements
This guide relates to the use of RhoSimulator through RhoStudio, an Eclipse-based IDE for Mac OS X and Windows. We recommend installing the RhoMobile Suite on your development machine, which includes RhoStudio and RhoSimulator, and is fully integrated with its use. RhoSimulator also can be invoked from the command line or integrated with an IDE that you’re already using.
1- Launch Your App in RhoSimulator
Using RhoSimulator from RhoStudio
After you’ve created at least one RhoMobile project, open RhoStudio and the project you’d like to debug. Then:
- From the Run Menu, select >> Run Configurations
-
In the left pane of the Run Configurations window you’ll see RhoMobile Application:
-
Double-click it to create a new Launch Configuration
OR
-
Single-click its arrow to edit an existing Launch Configuration (shown below)
-
Double-click it to create a new Launch Configuration
With the desired Launch Configuration selected, choose the Platform and Simulator type
- Click Run to deploy and run your app in RhoSimulator

In the example, a Run Configuration is shown for the iPhone platform and RhoSimulator. The resulting RhoSimulator screen should look similar to this:

2- Examine Code With Web Inspector
RhoSimulator presents two windows: One displays your application’s UI, and the other exposes its code in a multi-tabbed window. The first is referred to as the Device Window (similar to the one above), and the second is Web Inspector window (below), a powerful debugging aid that allows you to inspect and edit the HTML and CSS of your web interface and immediately see the effects of your changes.

Examining the DOM
In the context of modern web programming, the ‘DOM’ refers to your HTML code as it will appear when running. For example, while an HTML5 app might define certain variables, those variables contain no values until the app is actually running. So you might think of the DOM as HTML5 that’s live and in use.
You can examine the DOM in the Elements tab of Web Inspector. This tab shows the DOM tree structure of the HTML page that’s currently displayed in the Device Window. You can select and examine the code or individual elements in the DOM tree by using one of the following methods:
Using the Element Picker
Click on the ‘Magnifying glass’ icon in the bottom toolbar:

Then, move to the Device Window and click on the HTML element you want to inspect:

The selected element will then be highlighted in the Inspector Window, with its applied CSS styles shown in the right-hand pane and its heirarchy shown along the bottom:

Using the Search Elements box
You also can find particular attributes in the DOM using Search Elements. Click inside the Search Elements box in the upper-right corner and enter text, content or the tag name of an element or attribute you’d like to find. All items matching the search will be highlighted:

Expanding/collapsing the DOM tree
You also can navigate directly to the required HTML element by expanding/collapsing the DOM tree using the disclosure arrows to the left of all tags with children:

3- Live-Editing HTML and CSS
The Web Inspector permits live editing of HTML and CSS code and immediately renders your changes in the Device Window. This provides a quick way to preview HTML and CSS changes without having to go back to the IDE to edit, save and refresh. However, these changes exist only within the simulator. To make your changes permanent, you’ll need to update your code files once you’re satisfied with the changes.
| Changes in RhoSimulator are temporary and apply only to the code running inside the simulator. To make changes permanent, you must update your HTML/CSS files separately. |
The following changes can be made live:
Editing an element attribute
- Double-click the element attribute name or value
- Edit the text
- Press ENTER to apply the change or ESC to cancel
In the example below, a CSS class attribute is edited:

Editing element inner text
- Double-click the text inside the element
- Edit the text
- Press ENTER to apply the change or ESC to cancel
In the example below, the Login button’s text was changed to Sign in:

Editing an element tag
- Double-click the element’s tag name
- Edit the tag
- Press ENTER to apply the change or ESC to cancel

Deleting an element
- Single-click the element
- Press Delete key
Editing a style declaration
- Inside a CSS rule, double-click the property or value part of the declaration
- Edit the property or value
- Press ENTER to apply the change or ESC to cancel
In the example below, the text-align style was changed to right:

Disabling a style declaration
- Inside a CSS rule, locate the appropriate checkbox to the right of the declaration
- Add a check to temporarily enable; remove a check to temporarily disable
In the example, the text-align style left is temporarily disabled:

Adding a style declaration
- Double-click the opening or closing braces of a CSS rule
- Type in the property name followed by a colon and the value
- Press ENTER to apply the change or ESC to cancel
In the example, a new border-style is added:

Creating a new style rule
- Click the small ‘Gear’ icon to the right of the Styles heading
- Select ‘New Style Rule’
- Edit the selector as required and press Enter (or ESC to cancel)
- Type in the property name followed by a colon and the value
- Press ENTER to apply the change or ESC to cancel

Editing a style selector
- Under the Styles heading, Double-click the style rule’s selector
- Edit the text
- Press ENTER to apply the change or ESC to cancel

Other Web Inspector Tabs

There are a few other Web Inspector tabs that might be useful for debugging your app.
Resources Tab
The Resources tab allows you to see the resources being used by the current Webview page. Reources can include outside assets being called into your app such as images, JavaScript, stylesheets and cookies. Inspecting the resources can be useful if you want to make sure a particular resource has been loaded. This tab also can provide insight into other HTML5 features such as WebSQL and localStorage, if present.

| WebSQL and localStorage are HTML5-specific features that are used by certain WebKit-based browsers. They are not related to the Rhom database provided by RhoMobile. |
Network Tab
The Network tab measures and displays the time required for HTTP requests made by an application. Clicking on any of the resources in the left-hand pane will visually represent the delay as its headers and content are loaded and AJAX and other calls are made to remote servers. Data displayed when hovering over ‘Latency’ and ‘Timeline’ columns can be used to help optimize load-time performance.

Timeline Tab
The Timeline tool measures and displays the rendering time of each element of the user interface, presenting a visual display similar to that of the Network tab. The Timeline tab is useful for finding bottlenecks in front-end UI or DOM performance.
More information about Timeline can be found starting at 25:10 of Zebra’s Front-End UI Optimization Webinar. This one-hour video contains useful information about detecting reflows and other common problems that can bring mobile apps to a crawl.
4- Debugging JavaScript Code
Scripts Tab
The Web Inspector’s Scripts tab allows you to set breakpoints and inspect variables in your JavaScript code.
Setting breakpoints, inspecting variables
- From the dropdown near the top of the Scripts tab, select the JavaScript source file you want to debug.
- To set a breakpoint at a code line, click its line number. A breakpoint flag will appear.
- Next time you run, the app will pause at breakpoints (or after pressing the Pause button).
- When paused, inspect the values of JavaScript variables under the ‘Scope Variables’ header, at right.

NOTES:
- Local variables are displayed under the ‘Scope Variables’ heading.
- If you switch to a different stack frame under the ‘Call Stack’ heading, the local variables displayed will match the currently selected stack frame.
- Use ‘Watch Expressions’ to evaluate an expression every time the code is paused. These can include variables or any valid JavaScript expression.
- To remove a breakpoint, click on its line-number flag.
- Breakpoints also are presented in a list view under the ‘Breakpoints’ heading at right.
- Use the checkboxes in list view to toggle Breakpoints on and off.
Console Tab
The Console tab allows JavaScript execution and debugging and displays log messages generated by your code and by the system it’s running on.
Using the Console
Viewing the Console tab provides the greatest exposure for displaying large numbers of log messages:

You also can toggle a Console pane while in other tabs by using the Show Console button at the bottom-left corner of other tabs:

Logging
The Console logs errors and warnings from the system and logs messages generated by your application code. Messages can be filtered by type whether using the Console tab or viewing the Console through a pane:

Generating log messages
Log messages are not visible by the end-user, but can be extremely useful for debugging. Log messages are generated from JavaScript using the console.log() method:
Sample JavaScript code:
console.log('Hello, world');
Interactive JavaScript
In adddition to displaying log messages, the Console provides a fully interactive JavaScript execution environment that lets you evaluate valid JavaScript expressions, examine variables or object properties and invoke methods on objects.

Using Chrome’s Web Inspector
Optionally, you can debug the visual elements of your app with Chrome’s Web Inspector instead of the one in RhoSimulator. Google urges web developers to use Google Chrome Canary so they always have latest version Chrome DevTools, but all recent versions of Chrome include Web Inspector.
-
Once your app is open in RhoSimulator, point Chrome to:
http://localhost:9090/webkit/inspector/inspector.html?page=2.
- If neccessary, open the JavaScript console: View>>Developer>>JavaScript Console
Alternatively, you can navigate to http://localhost:9090 and click the link that references your start page (for example http://127.0.0.1:49964/app/index.erb if your app starts at /app/index.erb). You should see a screen similar to this:

On-Device Debugging With Weinre
Weinre is a must-have developer tool for testing or debugging RhoMobile JavaScript applications. Although lots of testing and analysis can be done using RhoSimulator, hardware features such as Barcode are unavailable in RhoSiumulator, and applications often look or behave differently when running on a device. Weinre solves these problems. Acting like a remote Web Inspector, the JavaScript Console in Weinre allows you to get familiar with the RhoMobile APIs right from the tab. This is faster and easier than fumbling through logs.
This guide is modeled after a 14-minute Weinre webinar that shows most of what we cover here in action. We’ll be using the Barcode Example app for all of the examples in this guide. You’re welcome to download the app and follow along, but it’s by no means necessary. You could follow along using your own app, or simply play around with the APIs and try out some code.
1- Install Weinre
| WARNING: You must have admin/sudo privileges to install Weinre, and the target device must be on the same Wi-Fi network as the development system. |
Weinre is a Node.js application and comes delivered via a Node Package installed with the npm command. Since Node.js is installed along with the Rhomobile suite, installing Weinre is as simple as running this Terminal command:
$ npm -g install weinre
Some Mac users may have to include the ‘sudo’ command:
$ sudo npm -g install weinre
For further installation and configuration instructions, visit Weinre’s installation site. If you did not install RhoMobile Suite, you can still use Weinre, but you might have to install Node.js separately.
2- Start Weinre
From the command line, launch Weinre using the boundhost option. This will bind it to your machine’s local IP address:
$ weinre --boundhost <your local IP address>
| Launching Weinre without this option will cause it to bind with the `localhost`, which is inaccessible from apps on a device. |
Weinre will display an IP address and port number similar to this:
2013-10-31T00:24:07.549Z weinre: starting server at http://192.168.1.128:8080
Point a browser to that address and port to verify that Weinre is running correctly. You should see a page similar to the following:

3- Enable Weinre In Your App
If all went well in Step 2, your browser is displaying the Weinre Inspector Remote console. In the section labeled ‘Target Script,’ you’ll see a string that contains a URL with your local IP address and port number, plus the name and path of the script file that Weinre needs to communicate with the target device.
Lower in the Target Script section is an example of how to embed the Target Script string between script tags:
EXAMPLE:
<script src="http://<your local ip address>:<your port>/target/target-script-min.js#anonymous"></script>
Copy and paste the example string (above) into the barcode_enumerate.html file (or the corresponding file for your app). Then copy your actual URL string referenced earlier and use it to replace the example URL. Be sure to leave the quote marks on either side of the URL.
TIP: In RhoStudio, the default double-click action for an HTML file is to open its browser representation in the editor. To edit the HTML itself, right-click the file, select ‘Open With’ and choose ‘Text Editor’ as shown below.

Here’s what the line should look like in the HTML:

4- Start the debug client UI
Start Weinre’s debug interface by clicking the link under Access Points in the Weinre Console:

Debug Client UI
The image below shows the ‘Remote’ tab of Weinre’s Debug Client UI. The ‘Targets’ and ‘Clients’ sections contain one device each, and the green text indicates that both devices are communicating.
The inset image is a screenshot from the target Android device that’s being displayed by an app called Droid@Screen. This useful screencasting tool uses USB and ADB to stream screen shots to the development host.

At this point, can inspect your app just as you would with the Web Inspectors of RhoSimulator or Chrome. The Elements tab shown below demonstrates two-way communication between the device and the development host. Clicking on an element in the HTML will cause that element to be highlighted on the device’s UI.

The Elements tab can be used for on-the-fly changes to CSS styling, API and method calls and any and all app UI settings. In the example below, the button text was changed from ‘Enumerate’ to ‘Changed!’ simply by editing the test in the Elements tab.
Button text 'Enumerate'

Button text 'Changed!'

Issuing API calls with Console
One of the most versatile components of Weinre is its Console. Not only does it offer classic capabilities such as device visibility and monitoring during operation, but the Weinre Console also can access all of a device’s hardware fearures, issue commands and report how the device reacts.
The example below shows results from an attempt to use the JavaScript API to check the target platform, use the camera to scan a barcode, and issue a command to the ScreenOrientation API (which returned an error).

In the example, I used the Console to verify that my JavaScript APIs are functioning properly. A return of the correct system platform of ‘Android’ proves that the System API is working. A return of the correct scanned barcode value likewise proves that the Barcode module is working properly.
There’s another important benefit of the Weinre console.
Notice that when the barcode callback handler function is executed, we are using the formconsole.log(e), whereeis the callback return object. That allows us to inspect the object right in the console. This simplifies validation because we see that it contains abarcodeproperty and astatusproperty, exactly as described in the Barcode.take( ) method description. Alternative means–such as adding code for outputting to a log, then for seaching and retrieving the information from the device–can be time consuming, tedious and error-prone.
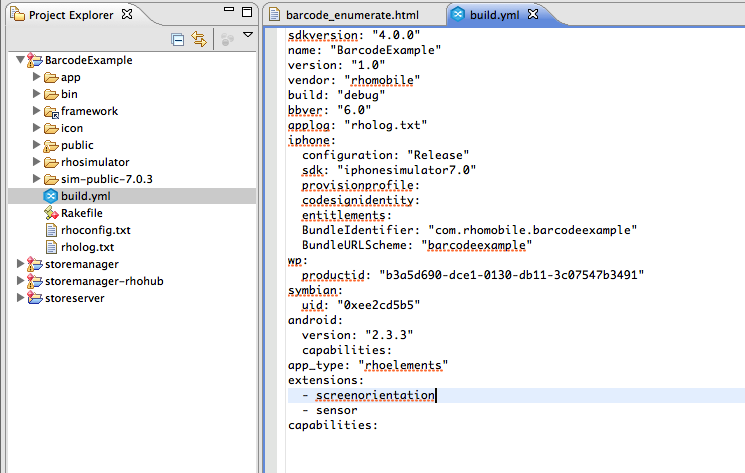
Extension Inclusion
Now we turn to the error thrown by the ScreenOrientation API call: TypeError: cannot call method 'normal' of undefined.
This indicates that it cannot find the module, and reminds us that the ScreenOrientation API is not included in RhoMobile apps by default. To include it in our build, it must be listed in the extensions section of the app’s build.yml before the app is rebuilt:
Since we did not remove the target script line from the HTML, the app should connect to Weinre as soon as it is rebuilt and activated. And now that the module is included and the framework is now aware of this module, the module name will auto-complete as it's typed into the Console. And instead of returning an error, the API call will change the orientation of the screen and return what it is supposed to: VOID, which in the console is represented by a null return.
To determine which extensions you'll need to add to your build.yml, please see the API Summary Page in our docs and click on the API you wish to use. The resulting module page will describe what needs to be done to use any given API.
Auto-Completing Code

Extension Working properly

On-Device Debugging With Chrome
If you’re building an Android app and have a device with Android KitKat 4.4 or higher, Google Remote Debugging is an alternative to Weinre that’s a bit easier to install and offers some fine visuals for testing, debugging and fine-tuning your app while it’s running on the device.
Google Remote Debugging works with native Android apps that use WebView–such as those built with RhoMobile–as well as purely browser-based apps. It includes live screencasting from the remote unit to the development host, and supports port forwarding and virtual host mapping in case your device needs to access a development server.
Requirements
- Mac OS X or Windows development host
- Chrome 32 or later installed
- A USB cable for connecting the target to the dev. host
- A target device running Android 4.4 (KitKat) or later
- USB debugging enabled on target
- An app configured for WebView debugging
1. Enable Device Debugging
The target device must have USB debugging enabled. This feature is found in Settings >> Developer Options panel, which is hidden by default.

Here’s how to unhide Developer options (if neccessary) and enable USB debugging:
- Go to Settings >> About Phone
- Go to the ‘Build Number’ box (by scrolling all the way to the bottom)
- Tap the Build Number box seven times
- Then, go back to Settings and tap Developer Options
- Enable USB Debugging by checking its box
2. Discover Device (in Desktop Chrome)
If you haven’t already done so, connect your device to an available USB port on the development host and enable device detection in Chrome:

Open a browser window and enter ‘chrome://inspect’ in the address bar. You should see a screen similar the one above.
Check the ‘Discover USB Devices’ checkbox. Your mobile device should appear along with an alert on the device.
Tap OK on the device to complete the connection
Linux- and Mac-based developers can skip to the next step. Developers on Windows must install a USB driver to make a USB-attached Android device visible. Visit Google’s USB Driver page for instructions and links to OEM drivers for your brand of hardware.
The final step is to configure WebView for debugging, which must be done from within the app. Fortunately, RhoMobile developers can skip this step too because the WebView components used by the RhoMobile Suite are automatically configured for debugging when deployed to devices with debug mode enabled.
At this point you should be ready to begin debugging. Once your app is deployed and running on the device, the chrome://inspect page should look something like the one shown below, with your device and a link to its debug-enabled WebViews. To begin debugging, click an inspect link.
Running RhoSimulator From the Command Line
RhoSimulator can be executed from the command line and thereby integrated with your favorite IDE or inspected with alternative tools. To run RhoSimulator from the command line, use one of the following platform-specific commands from within the folder containing the app to be simulated:
-
Android
rake run:android:rhosimulator
-
iOS
rake run:iphone:rhosimulator
-
Windows Phone 8
rake run:wp8:rhosimulator
-
Windows Mobile
rake run:wm:rhosimulator
-
Windows (desktop)
rake run:win32:rhosimulator