Remote Debugging Your RhoMobile JavaScript using Weinre
Weinre is a must have developer tool for testing or debugging your JavaScript RhoMobile application. Although a lot of testing and analysis can be done using RhoSimulator, sometimes the application behaves differently on a device and you can’t test hardware features like Barcode in RhoSiumulator. Weinre allows you to do all of this. Think of it as a remote Web Inspector. It also allows you to get familiar with the RhoMobile APIs right from the Weinre JavaScript Console tab much more rapidly then trying to fumble around with reading through logs.
For those who would rather see it in action, this guide is modeled after a webinar that shows most of what we are going to cover here. We will also be using the Barcode Example app for all of the examples in this guide. You may download it and follow along but the app is by no means necessary. You can use Weinre with any application or simply if you would just like to play around with the RhoMobile APIs to try out some code.
- Installing Weinre
- Starting Weinre
- Enabling Weinre In Your App
- Debug Client UI
- Console and Issuing API Calls
- Extension Inclusion
Installing Weinre
Note: You must have admin/sudo privileges to install weinre and your device must be on the same WiFi network as your laptop.
Weinre is a Node.js application and comes delivered via a Node Package installed with the npm command. Since Node.js is installed along with the Rhomobile suite, installing Weinre is as simple as running the command:
$ npm -g install weinre
Note: Mac users you may have to include the ‘sudo’ command
More details around the installation process and configuration of Weinre can be found on Weinre’s installation site. If you did not install RhoMobile Suite, you can still use Weinre, but you will have to install Node.JS separately.
Starting Weinre
Open a command prompt and start Weinre with your local machine’s local IP address using the --boundHost option. If you just launch weinre on it’s own it will be bound to the localhost which will be unaccessible from your device’s application.
$ weinre --boundHost <your local IP address>
Note: Note the capital ‘H’ in boundHost. If you instead use the option boundhost, it will not launch properly.
Weinre will print out the address and port that you will use in order to continue.
For example, here is my output from the above command
2013-10-31T00:24:07.549Z weinre: starting server at http://192.168.1.128:8080
Verify that Weinre is running correctly by navigating your browser to the address Weinre gives you. You should see a page like this.

Enabling Weinre In Your App
Notice the section in the web console labeled “Target Script”. This is a string that you must copy into your app in order for Weinre to be able to interact with your app. This string is <script src="http://<your local ip address>:<your port>/target/target-script-min.js#anonymous"></script>. I’m going to put this line into my barcode_enumerate.html file so that when I load that file in my app, it will connect to Weinre and start capturing info. Remember when editing HTML in RhoStudio, the default double click action is to open the browser representation in the editor, so to edit the HTML itself, make sure to right-click the file and select open with “Text Editor” as shown below. After editing this file, you would rebuild and relaunch the application so that the changes take effect.

Here is what the line looks like in my HTML:

Now that we have those steps out of the way, it’s time to start up Weinre’s debug client user interface by clicking the link in the Access Points section of the page we just loaded in our browser.

Debug Client UI
You may notice that there are many options at the top of the debug UI that very closely resemble the tools available in the Chrome Web Inspector. This is not by accident, these tools serve the same purpose as they would in the Chrome Web Inspector but these are for inspection on the device.
Here you see both the Weinre debug UI connected to my device (when the device is connected, the Targets and Clients fields are populated with green text describing the device connection.) and my device’s screen. I am screen-casting my Android device’s screen to my monitor with the help of an app called Droid@Screen which uses USB and adb in order to stream screen shots to your computer. It’s got some lag but is very useful.

Now you can inspect your app just as you would any other HTML page if you were using the Chrome web inspector. Select the Elements tool at the top of the page and select an element to inspect. You will also see the element highlighted on your device showing you that two-way communication is established.

You can use the Elements tool to change things on the app’s view on the fly just by changing the code in the inspector itself. For instance, in the below images I am simply changing the text on the button from “Enumerate” to “Changed!”.
Button text "Enumerate"

Button text "Changed!"

You can change pretty much any part of the view such as CSS styling and even which APIs and methods are called, but I chose to do a simple one for brevity’s sake.
Console and Issuing API Calls
One of the most helpful features of Weinre is the console. You can use this console as the classic console to see what is happening on the device while in operation. However, with this console we can do more than just look at what’s happening on the device, we can also issue commands to the device to see how the device will react. This is especially helpful since all of the hardware APIs in RhoMobile will only work on actual hardware, which means they cannot be tested in the RhoSimulator.
In this example, I am showing just a few commands that can be run from the console to verify that the JS APIs are operating properly. Here I use the JS API to check the platform I am running on, use the camera to scan a barcode, and then issue a command to the ScreenOrientation API which returns an error.

As you can see, I have verified using API calls that my JS APIs are functioning properly. My device is a Zebra Technologies ET1 which is in fact an Android device, so we know that the System API is working. The item’s barcode that I scanned reads exactly what was returned here by the Barcode.take() method, so I know that the Barcode module is working properly.
Notice that when the barcode callback handler function is executed we are doing a console.log(e) where e is the callback return object. We can then simply inspect the object right in the console and see that it contains a barcode property and a status property. Exactly what is described in the Barcode.take() method description. Using other means like looking in Rholog.txt for information like this may be very time consuming and tedious to add code to output to the log, retrieve it from the device, etc.
Extension Inclusion
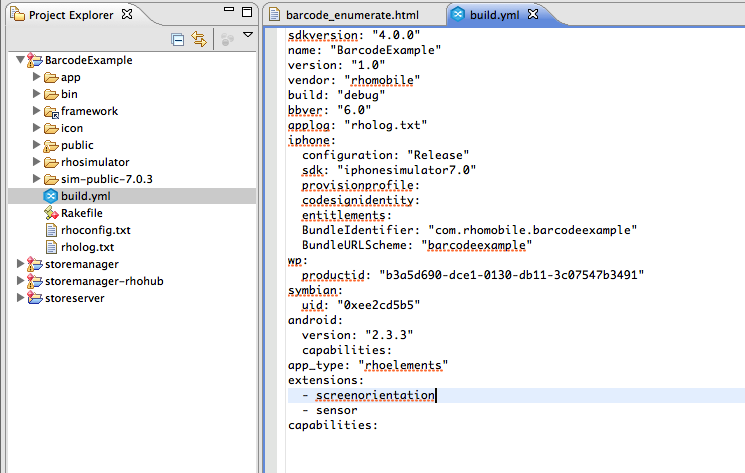
Now notice the error I received from the last API call: TypeError: cannot call method 'normal' of undefined. This error means that it cannot find the ScreenOrientation module. This is because ScreenOrientation is not included by default in RhoMobile apps. To add this module in, all we have to do is list it in the app’s build.yml in the extensions section as shown below and then rebuild the app.
Once the app is rebuilt, it should connect to Weinre as soon as it is activated as we did not remove the target script line from the HTML. Back in the console, now that the module is included you should notice that the module name will auto-complete since the framework is now aware of this module. And since this module is now available, the API call I made before will not return an error but will return what it is supposed to: VOID, which in the console is represented by a null return. It also change the orientation of the screen.
To tell whether or not you'll have to add the extension into your build.yml please see the API Summary Page in our docs. Click on the API you wish to use and the corresponding module page will describe what needs to be done to use the API in question.
Auto-Completing Code

Extension Working properly

Other Tabs in Debugger UI

There are a few other tabs that we have seen in the debugger UI that I should briefly mention.
Network Tab
This tab is great for inspecting what files the application is obtaining from the ‘server’. Remember that when building a RhoMobile application, the ‘server’ is normally running on the device as well. However it is still important to inspect this as unnecessary processing of JavaScript or CSS files may be giving your application a lag that you may not have noticed while running the app in RhoSimulator. There are many resources on the internet that describe using this tab in detail either in the context of Weinre or Chrome Dev Tools. Be sure to be aware of how to use this useful resource when optimizing your application.
TimeLine Tab
This tab is great for inspecting front-end UI or DOM performance. Each action in your user interface will be displayed and you can inspect for bottle necks in rendering, or other areas. Again there are many resources on the web that discuss this feature. We also did a full webinar on the topic for detecting Reflows and the usual CSS suspects for performance hits on devices. Be sure to get familiar with these concepts and include them in your routine for application optimization.
Resources Tab
The resources tab provides information about the various resources associated with a page. This is useful if you want to make sure a resource (e.g. an external script or stylesheet) has been loaded or for checking out the cookies. You can also look at some HTML5 features like localStorage or WebSQL.
Note: localStorage and WebSQL are not related to the Rhom database that RhoMobile provides. These are HTML5 specific features that are provided with WebKit based browsers.